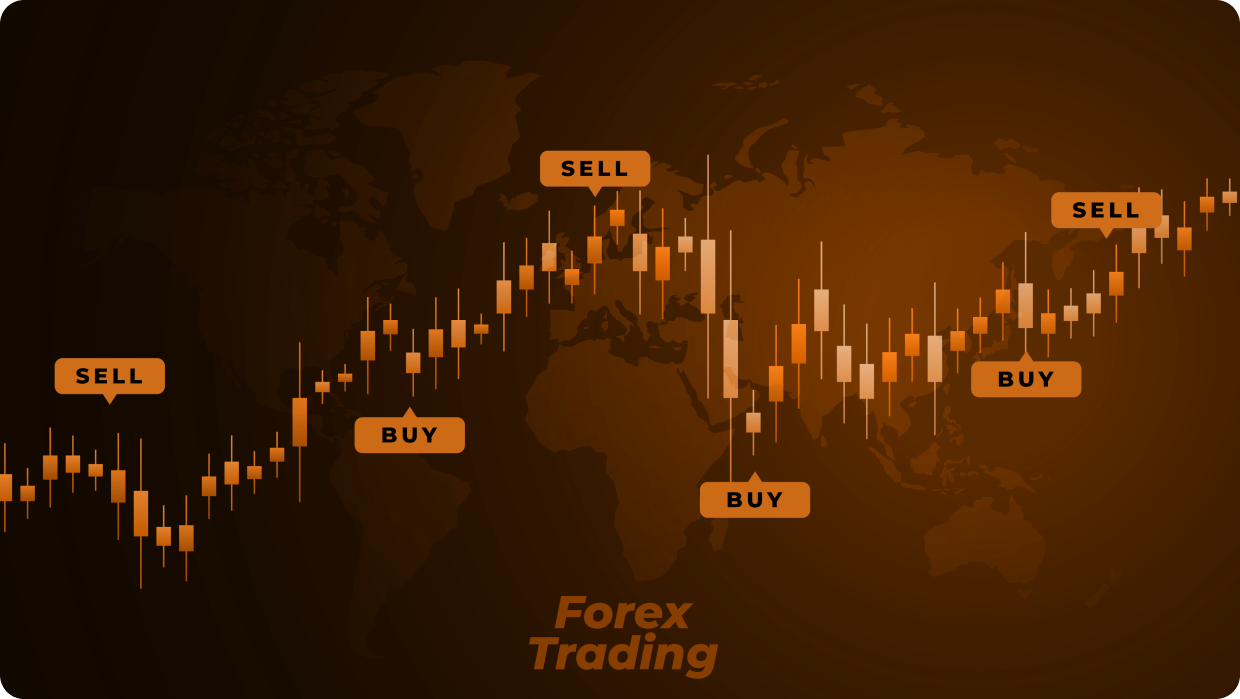
Imagine a one-hour candle on EUR/USD. The market opens the hour at 1.0850, pushes up to 1.0870, drops to 1.0840, and closes at 1.0865. The body runs from 1.0850 to 1.0865 (green, because close is above open), the upper wick reaches 1.0870 and the lower wick reaches 1.0840. One shape, four facts, and a story: buyers won the hour, but sellers tested both sides.
Beginners memorize pattern names. Professionals read the fight. A long body with tiny wicks means one side dominated. Long wicks with a small body mean the battle was violent but indecisive. A long lower wick at a support level means sellers pushed down and were firmly rejected. Once you read candles as buyer-versus-seller reports, you no longer need to memorize fifty patterns.
Patterns mean almost nothing in the middle of nowhere. A hammer in random space is noise; a hammer at a level the market has respected three times is information. Context first, pattern second. This is why in our sessions we mark levels before we ever discuss candle shapes. Veteran traders often repeat a line worth keeping on your desk: the pattern is the trigger, the level is the reason. Learn levels, then let candles time your decisions.

An honest forex education community by Kishor Kotambe. Learn the markets, build the skill.